[av_one_full first min_height=” vertical_alignment=” space=” custom_margin=” margin=’0px’ row_boxshadow=” row_boxshadow_color=” row_boxshadow_width=’10’ link=” linktarget=” link_hover=” padding=’0px’ highlight=” highlight_size=” border=” border_color=” radius=’0px’ column_boxshadow=” column_boxshadow_color=” column_boxshadow_width=’10’ background=’bg_color’ background_color=” background_gradient_color1=” background_gradient_color2=” background_gradient_direction=’vertical’ src=” background_position=’top left’ background_repeat=’no-repeat’ animation=” mobile_breaking=” mobile_display=” av_uid=’av-2rzevj’]
[av_textblock size=” font_color=” color=” av-medium-font-size=” av-small-font-size=” av-mini-font-size=” av_uid=’av-k2bkxah4′ admin_preview_bg=”]
The real way to use Bollinger Bands
What is Bollinger Band?
The Bollinger Band is one of the most popular trading indicators in the world today. Forex traders, Stock traders, options traders and every other type of trader in the world have come across Bollinger Bands at one point in their trading career.
In short, there are 3 lines that make up a Bollinger Band:
- Top Band = 1 standard deviation up
- Bottom Band = 1 standard deviation down
- Middle Band = Simple Moving Average (20 period)
What does standard deviation mean?
One annoying thing about the world of trading is that everyone assumes you already understand the concept of standard deviation, many people don’t understand and we will make this incredibly clear and easy with a picture. 
Do Not Panic. There are only 2 items you need to understand to benefit from this chart.
μ = Mean or Average
The best way to understand the average is through the use of a favorite example – high school. If there are 10 students in a class and 8 of the students receive 60% on their final exam and 2 students receive 100%, then the average score or μ for that class is 68%.
The calculation is simple.
- Add the individual marks (60%+60+60%+60+60%+60+60%+60+100%+100%) = 680%
- Divide the above total by the number of grades which is 10 in this example (since there are 10 students)
- 680%/10 students = 68% so the average or μ = 68%
σ =Standard Deviation or Sigma
You’ve probably heard the term “outlier” before to try and explain something that is so far outside the world of normal, something truly extraordinary. The term “outlier” actually comes from the world of statistics and its something statisticians use to explain something that doesn’t normally happen.
The big question is how do they define “normal”? Normal is defined by μ, which is average. If we continue with our example, normal is 68% as that is the average and the outliers in that example are the two students who received 100% on their exam as they are really far away from that normal average level.
The important thing to note is that you DO NOT have to know how to calculate the standard deviation to be able to use it effectively in trading. You simply need to understand what it represents.
It’s really easy. Always start from the average number. From there, if someone says 1 standard deviation to the right, that would represent 34.1% of all the results, if we then include 1 standard deviation to the left, we would add another 34.1% of all results. In short, 68% of all the results are expected to be in the green section of the above chart. All of that probably still sounds very confusing so let’s relate this back to trading.
Assume the price of a stock has been moving up and moving down – as it usually does. Some days it’s up a few dollars and other days it is down a few dollars. If you looked at the price of the stock over a few weeks, you’d be able to calculate an average price. With an average, you can calculate the standard deviation – which you don’t need to calculate since the trading platform will do this for you. If you draw a line 2 standard deviations higher than the average price and another line 2 standard deviations lower than the average price, you would then have what we call a Bollinger Band!
The idea behind the Bollinger Band is that 95.4% of all the previous prices are between the top and lower bands, many people use the Bollinger Band for range trading but this is not the best way to use this great trading tool.
Using the Bollinger Band as a Trade Signal
Most people use the Bollinger Bands to trade range bound markets. Explained another way, they buy when the price reaches the lower band and they sell when the price reaches the higher band. Why do they do this? It’s quite logical really, they are doing this because ~95% of the previous prices have been within those two bands in the recent period, so it does make sense to do this. The problem is that this gives a large number of false entries and while it may work sometimes, the big gains come from entering on a breakout and not from range trading.
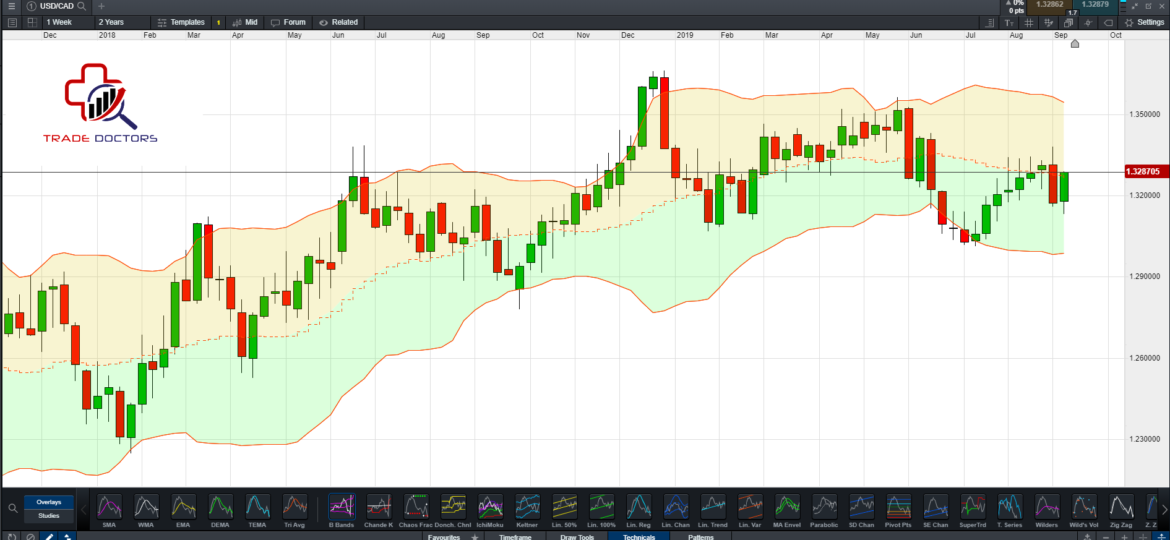
Here is a quick look at how most people are currently using the Bollinger Band indicator:

They buy where it’s blue and they sell where it’s orange but notice how price has a tendency to trade beyond those levels, making it very difficult to calculate appropriate risk/reward ratios – for more information on risk reward, check out our article on why trader’s fail here.
The real pros understand that it’s about capturing that fat tail in trending markets which simply means the biggest opportunities in the market come from trading with the trend and riding it out. If 95% of the previous prices are found within the two bands, then surely a break outside these bands should be a significant signal.
In fact, it’s a very powerful signal that many pros use in combination with other indicators prior to taking their trades.
Observe the below chart and notice how much more profit a trader can generate when trading the breakout. This strategy results in much greater profits over a range bound strategy – almost 10% gain in less than 2 weeks in that example.

Conclusion
There are hundreds of ways to use every indicator but some work better than others. It’s important to consider your personal trading style when deciding whether to use Bollinger Bands or not as it might not be a good fit.
If you’d like to know more about various trading styles, take a look at our ultimate forex trading guide here. Once you’ve decided you want to use Bollinger Bands, you’ll need to decide when to actually take that trade. You should not simply buy when the price breaks the top band or sell when the price breaks the bottom band. You need to establish clear rules before doing so, an idea would be to buy only if the signal bar breaks by more than 1x ATR (Average True Range) – there are many options.
[/av_textblock]
[/av_one_full]