[av_one_full first min_height=” vertical_alignment=” space=” custom_margin=” margin=’0px’ row_boxshadow=” row_boxshadow_color=” row_boxshadow_width=’10’ link=” linktarget=” link_hover=” padding=’0px’ highlight=” highlight_size=” border=” border_color=” radius=’0px’ column_boxshadow=” column_boxshadow_color=” column_boxshadow_width=’10’ background=’bg_color’ background_color=” background_gradient_color1=” background_gradient_color2=” background_gradient_direction=’vertical’ src=” background_position=’top left’ background_repeat=’no-repeat’ animation=” mobile_breaking=” mobile_display=” av_uid=’av-2xt16n’]
[av_textblock size=” font_color=” color=” av-medium-font-size=” av-small-font-size=” av-mini-font-size=” av_uid=’av-k2f8axu8′ admin_preview_bg=”]
The art of drawing a professional trendline
Chart analysis has been around since the early days of trading. By drawing straight lines and creating geometric formations, traders can gain a significant edge in their trading.
There are numerous research papers dedicated to disproving the usefulness of chart patterns. For each of these papers exists an equally well-crafted study showing their immense benefits.
There are six major groups of chart patterns:
- Trendlines and channels
- One-day patterns
- Continuation patterns
- Accumulation and distribution patterns (bottoms and tops)
- Retracements
- Other Patterns
Trendlines
It’s fairly easy to determine the direction of a trend after it’s already happened. The difficult part of trading is trying to identify when the trend direction is about to change. Taking a position earlier on and staying the course for large profits is what the pros are able to do.
The trendline indicates the direction of price movement and is the most recognized tool of chart analysis. The majority of traders and financial analysts will agree that the trend is your friend and anyone taking trades counter to this trend does so with greater risk.
- An upwards trendline is drawn across the lowest prices in a rising market
- A downwards trendline is drawn across the highest prices in a decline market
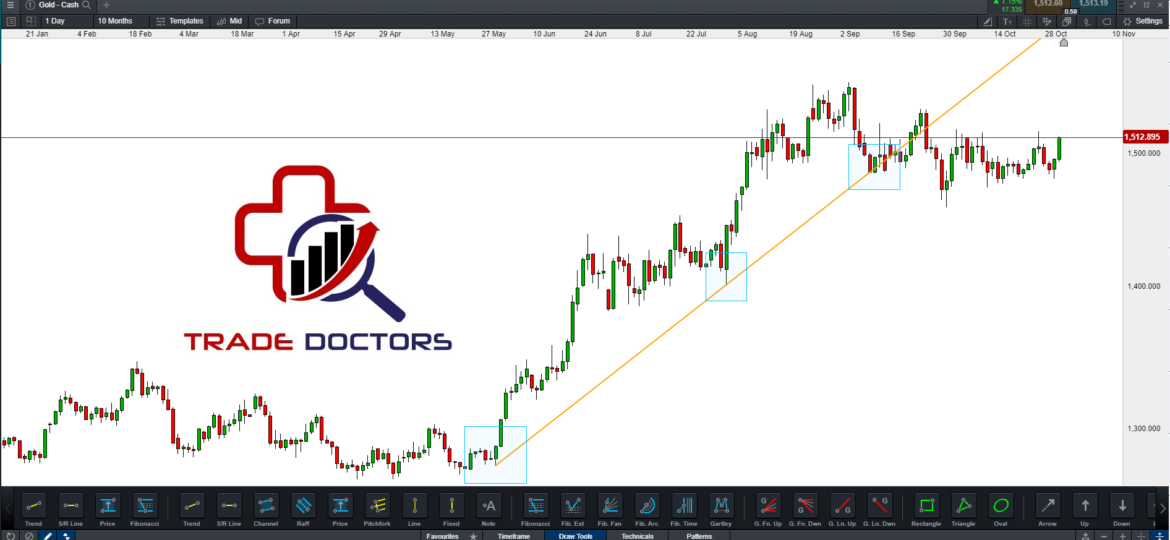
How to draw and redraw the trendline
As we mentioned before, it’s easy to draw the line after it’s already happened but how do you draw it while the trend is happening? Many beginners believe they need to determine the correct line immediately but this is a misconception and is not correct. Professional traders redraw the trendline several times as the trend develops and more information becomes available.

A key point to note is that the line is more significant on the higher timeframes and is more powerful the more times the price bounces off the line. If you can draw a line where price has come down to the trendline and bounced off from it 5 times vs another line where price has bounced off of it 2 times, the one with more touches is much more reliable.
Golden Rules for Timeframe
- Monthly trends are more powerful than weekly trends
- Weekly trends are more powerful than daily trends
- Daily trends are more powerful than hourly trends
- Anything smaller than an hourly trend is not as reliable given short term volatility
Golden Rules for Touch Points
- A trendline requires a minimum of two points (touches) to be valid
- A trendline is considered broken ONLY if price closes below (in an uptrend) or above (in a downtrend) simply crossing the trendline does not mean the trend is broken
- 5 or more touches on a daily, weekly or monthly timeframe is an extremely powerful trend
When is the trendline broken?
The million dollar question for all new and professional traders is how to determine when the trend is over. When the instrument is is trading sideways and when the trend is changing direction.
Having a clearly objective trading plan is very important when answering the above questions. One trader may have a different opinion to another trader and both may know the statistical probability of a reversal taking place based on their trading system. In our complete guide to trading, we go through the importance of setting up a trading plan and a few ways of writing these rules.
In actual trading, the price crossing the trendline is not often as clean as you’d like it to be. Most often prices that have been moving higher will cross below the trendline, then recross moving higher, then move lower again. Trendlines offer important turning points, and there may be indecision that is reflected in a sideways price movement. To deal with those situations, traders may do the following:
- Wait a set time prior to entering to confirm that prices remain on the new side of the trendline.
- Wait for a reversal after the penetration, then enter a trade in the new direction
- Create a small safety zone (like a buffer) around the trendline and enter the new trade if prices move through the trendline and through the buffer – our personal favorite.
Conclusion
There are 1000 ways to draw a trendline but the best method is the one where you are the most consistent. If you change the way you draw these lines, it will make it impossible to calculate results and make you profitable. Being consistent in the way you do everything in trading is the key to how professional traders are able to calculate the probability of entering a successful trade. In our guide on why traders fail, we go through the importance of a trading plan and how to approach trading like a professional money manager.
[/av_textblock]
[/av_one_full]